
Measuring Social Cohesion in South Africa
- Inclusive Society Institute
- Apr 21, 2022
- 50 min read

Copyright © 2022
Inclusive Society Institute
50 Long Street
Cape Town, 8000
South Africa
235-515 NPO
All rights reserved. No part of this publication may be reproduced or transmitted in any form
or by any means without the permission in writing from the Inclusive Society Institute.
DISCLAIMER
Views expressed in this report do not necessarily represent the views of the
Inclusive Society Institute or those of their respective Board or Council members.
Author: Daryl Swanepoel
April 2022
Content
1. Introduction, background on social cohesion and motivation for survey
1.1. What is social cohesion and why it matters?
1.2. What are the elements of social cohesion?
1.3. What drives social cohesion?
1.4. Obstacles to social cohesion
1.5. Systems to achieve social cohesion
1.6. Conclusion and motivation for study
2. Survey methodology
2.1. Desktop review
2.2. Survey
2.3. Assessment tools
2.4. Limitations of the study
3. Findings
3.1. South Africans remain committed to ‘unity in diversity’
3.2. South Africa has worrying trust issues
3.3. Emigration could reduce South Africa’s skilled workers by 11 percent
3.4. South Africans don’t sufficiently trust immigrants
3.5. South Africans deeply distrust their compatriots from other parties
3.6. High sense of community provides solid foundation on which to build social cohesion
4. Further discussion, assessment, and conclusions
References
List of tables
Table 3.1.: Reconciliation moving in the right or wrong direction indicated by race
Table 3.2.: Level of everyday life integration indicated by race
Table 3.3.: Trust differentiation between persons known and met for the 1st time
Table 3.4.: Top five emigration destinations
Table 3.5.: Trust in people from other parties – based on gender
Table 3.6.: Comparative chart on giving patterns of the different race groups
Table 4.1.: Assessment of conditions that promote social cohesion
Table 4.2.: Evaluating social cohesion in terms of demographic integration,
connectedness, and community
List of figures
Figure 1.1.: Social Cohesion Triangle
Figure 3.1.: Percentage of South Africans who are doubtful one nation can emerge
Figure 3.2.: Percentage of South Africans wanting the country to unite
Figure 3.3.: Percentage of South Africans against association with other racial
groups
Figure 3.4.: Differentiation based on gender, education, or income considerations
Figure 3.5.: Trust of neighbours based on race, age, education, and income
Figure 3.6.: Trusting those from other religions
Figure 3.7.: Trust for black South Africans
Figure 3.8.: Trust for white South Africans
Figure 3.9.: Comparison with regard to in-group trust
Figure 3.10.: Percentage of population considering emigration – by race
Figure 3.11.: Top 5 reasons for emigrating
Figure 3.12.: Percentage of population considering emigrating – by age
Figure 3.13.: South Africans not trusting African immigrants – based on party
affiliation
Figure 3.14.: South Africans not trusting African immigrants – based on provinces
Figure 3.15.: South Africans not trusting non-African immigrants – based on party
Figure 3.16.: South Africans not trusting non-African immigrants – based on
provinces
Figure 3.17.: Comparison: distrusting South Africans by race and party-political
affiliation
Figure 3.18.: People willing to trust compatriots from other parties – based on age
Figure 3.19.: People willing to trust compatriots from other parties – based on
education
Figure 3.20.: People willing to trust compatriots from other parties – based on race
Figure 3.21.: People willing to trust compatriots from other parties – based on
income
Figure 3.22.: Percentage of people trusting supporters of the same party
Figure 3.23.: Percentage of people willing to trust those from other parties
Figure 3.24.: South Africans getting involved in the community – based on age
Figure 3.25.: South Africans getting involved in the community – based on education
Figure 3.26.: South Africans getting involved in the community – based on income
Figure 3.27.: South Africans getting involved in the community – based on race
Figure 3.28.: South Africans getting involved in the community – based on party support
1. Introduction, background on social cohesion and
motivation for survey
South Africa is emerging from a divided past. The obvious division being that of race, where separation between the various race groups was ferociously enforced during the apartheid years.
Apartheid was a system of segregation in South Africa that enforced racial separation. After the National Party took power in 1948, the government enforced segregation policies by separating non-white citizens into separate areas with separate public facilities. Contact in everyday life was limited (History, N.d.).
The general election in 1994 ushered in a new democratic order in which all citizens were to be considered free and equal, regardless of race, language, religion, and/or sexual orientation. The democratic order that was established in South Africa was the result of a political settlement between the African National Congress, the broader liberation movement, and the then National Party government. The objective of this settlement was to put an end to apartheid and establish a new democracy based on values aimed at removing social and racial discrimination which permeated general society (The Presidency, N.d.).
The nation has since been on a journey of reconciliation. Under President Mandela much progress was made in bringing the various racial groups in the country together, but, some argue, reconciliation has stagnated, and fragmentation remains embedded, driven largely by a divisive [social and] political narrative (Tau, 2021).
But racism is fuelled by more than just the pigment of one’s skin. There are a myriad of factors that drive wedges between communities – inequality being one. 64% of black South Africans remain poor, 40% of coloured people remain poor and then, on the other hand, 6% of Indians and Asians are poor and only 1% of whites are poor (SAHRC, 2021). Inequality, for example, manifests along racial lines in the health sector, where only 16% of the population is covered by medical aid, 72% of whom are white, 17% coloured, and 10% black Africans (Pikoli, 2021). There are numerous other such socio-economic divisions which could be cited to equal effect.
Regional economic instability also exacerbated fragile relations in the country, as millions of migrants, some legal, many illegal, have been driven to South Africa. This has led to many charging these immigrants of “stealing our jobs”, serving to promote xenophobia, often with violent consequences (Matema, 2021).
Over the years there have been numerous attempts to assess the state of racial relations in South Africa, as well as attempts to measure socio-economic conditions, including the level of xenophobia in the country. There however seems to be a dearth of measuring instruments, bringing all the elements together with specific intent to promote social cohesion, reconciliation, and nation-building.
As discussed in the sections that follow, social cohesion is dependent on all these factors being addressed simultaneously. To this end, the Inclusive Society Institute has resolved to develop a comprehensive Social Cohesion Index or Radar, which will enable policymakers to track progress annually as to headway being made on social cohesion. This report serves as a precursor to such an index.
1.1. What is social cohesion and why it matters
“At [the] heart [of social cohesion] is the notion that relationships among members and groups in society are sufficiently good and that all feel a sense of belonging, that they perceive the whole society as greater than the parts, and when differences develop, they can be dealt with peacefully” (Langer et al., 2017).
In socially cohesive societies there is generally an “absence of latent social conflict”, for example conflict based on wealth, ethnicity, race, and gender; and “presence of strong social bonds”, for example civic society, responsive democracy, and impartial law enforcement (SFRI, N.d.).
“Social cohesion involves building shared values and communities of interpretation, reducing disparities in wealth and income, and generally enabling people to have a sense that they are engaged in a common enterprise, facing shared challenges, and that they are members of the same community” (Maxwell in SFRI, N.d.).
The OECD defines a cohesive society as one that works towards the well-being of all in society, “fights [all forms] of exclusion and marginalisation, creates a sense of belonging, promotes trust, and offers its people the opportunity of upward mobility” (SFRI, N.d.).
Thus, social cohesion drives long-term prosperity and competitiveness because cohesive societies are politically stable and focus on economic growth. It allows everybody in society to share equitably in its prosperity (Bris, 2014).
1.2. What are the elements of social cohesion?
There are a number of dimensions to social cohesion, namely inequality, trust, and identity.
Inequality – that is the extent of perceived inequalities within and across groups, which can manifest itself in various forms, such as economic, social, political, or cultural disparities. Social cohesion is threatened when there are high levels of inequalities within a society, because it erodes the relationships within that society, which, in turn, may cause conflict.
Trust in others – societal trust is the “glue” that holds societies together. When trust is missing between members of society, it weakens the ability of individuals and groups to cooperate peacefully and to collaborate in order to achieve inclusive economic growth. Mistrust towards state institutions may, for example, fuel violent protests, and similarly, mistrust between individuals and/or groups may cause aggressive behaviour towards each other.
Identity – this relates to whether people have a stronger adherence to their national identity vis-à-vis their group or ethnic identity. This is particularly applicable in multi-ethnic communities, more so in countries with a colonial history, such as South Africa.
(Langer et al., 2017).
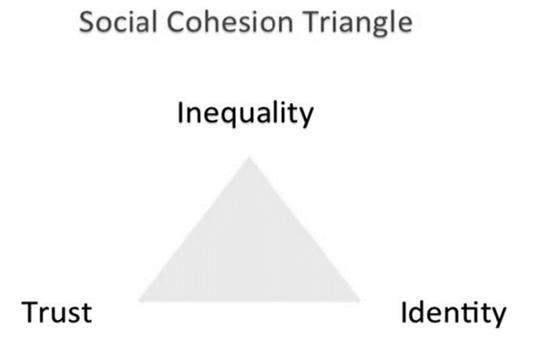
Figure 1.1.: Social Cohesion Triangle (Source: Langer et al., 2017)
1.3. What drives social cohesion?
The main determinants that drive social cohesion in society are racial diversity, economic inequality, education, historical events, GDP, subjective well-being, and health.
1.3.1. Racial diversity
Racial diversity offers a very strong group demarcation. Divisions across ethnic and racial lines is often considered as the main obstacle to social cohesion, as it offers a very strong group demarcation, even more so than gender and/or age. It has a tendency of categorising people into groups, to identify with one group and to draw comparisons across groups (Tänzler & Grimalda, 2018).
1.3.2. Economic inequality
Economic inequality generally has the negative impact of income inequality and horizontal trust. This is due to lack of confidence that one will profit from societal progress. As a side note, given the South African environment, there is evidence that immigration has a negative effect on social cohesion in countries with high levels of economic inequality (Tänzler & Grimalda, 2018).
1.3.3. Education
It has been found that there is a positive correlation between education and social cohesion. This is because mutual identity and societal cooperation is one of the principle purposes of public education (Tänzler & Grimalda, 2018).
1.3.4 Historical events
In line with the idea that cultural values may be lasting, there is evidence that historical events have a long-term impact on social cohesion. Trust is, for example, still lower among ethnic groups in Africa which were most affected by slave trade and colonialism in the past. (Tänzler & Grimalda, 2018). The lasting legacy of apartheid being particularly relevant to South Africa and this study.
1.3.5. GDP
Social cohesion has both a direct positive effect on GDP, as well an indirect effect, through the facilitation of better institutions, systems, or the ability to express and live out one’s freedoms. One may consider huge economic costs of inter-racial conflict and war. Similarly, countries whose GDP was more strongly affected during economic crises, typically do not have cohesive societies (Tänzler & Grimalda, 2018).
1.3.6. Subjective well-being
There exists a positive connection between well-being and overall social cohesion. Increased trust has, for example, the same impact on life satisfaction as a two-thirds increase in household income (Hellwell & Wang, 2011 in Tänzler & Grimalda, 2018).
1.3.7. Health
To illustrate the correlation between social cohesion and health, data from 39 US states show that social cohesion fosters both mental and physical health. It has also been demonstrated that a disinvestment in social capital leads to the rise of mortality rates (Kawachi & Berkman, 2001 in Tänzler & Grimalda, 2018).
1.3.8. Religion
On the one hand there is evidence that religious groups and institutions build social cohesion within communities by fostering integration and societal interaction. On the other hand, religious denominations often differ greatly in terms of doctrine, and come into conflict with those in the community beyond their own belief. Often, bonding efforts may have “the opposite effect by increasing group insularity and, in turn, social fragmentation” (Andrews, 2011).
1.3.9. Culture
Here too there are two sides to the coin. On the one hand, “acceptance of diversity and the interaction between cultures foster harmonious relations between people [and] enrich their lives. It is not the denial, but rather, the recognition of differences that keeps a community together”. On the other hand, there needs to be mutual respect for the differences, because without such, “communities may turn in on themselves, ultimately leading to their disintegration, decline or disappearance” (Jensen, 2002).
1.4. Obstacles to social cohesion
In a study of twenty disadvantaged neighbourhoods in London, the researchers found that, across all the areas studied, “lack of community” emerged as a strong theme. A number of key barriers to building communities emerged from the study.
Young people. The participants expressed strong anxieties about young people in their communities, many of whom seemed attracted to gangsterism, disrespect for and destructive crevices between them and older persons. The behaviour was driven by young people that “had nothing to do”, that were bored, and who lacked self-respect, needed self-protection, and did not have sufficient community activities to participate in. The breakdown of the family unit was also problematic in that they wanted to feel connected, which need was not satisfied within the family, driving many to gangsterism and untoward behaviour.
Lack of safety. Crime emerged as a strong barrier to the development of solid communities. This is because when crime is rampant in society, people are afraid to go out and interact with one another.
High levels of transience. Participants identified the high level of community turnover as a barrier, in that people found it difficult to “get to know their neighbours”. In turn, this affects safety and security, as the ability and willingness to “look out for one another” is diminished. So too, as neighbourhoods became increasingly ethnically and culturally diverse, and in areas of high numbers of immigrants, sensitivity as to the safeguarding of their rights emerged.
Racism. Tension between ‘cultures’ is a strong force to divide the community along ethnic lines, which often results in racist incidents and behaviour that contributes to ethnic segregation.
Language. Being unable to communicate with one another was felt to be a significant barrier to achieving more cohesive communities, since it contributed to mutual suspicion, feelings of isolation, and lack of interaction between different groups.
Lack of activities and information about activities. Activities and events are opportunities to get out of the house and interact with one’s local community. The lack of such activities weakens opportunities to build community spirit.
Provision of accessible and affordable/free community spaces. Easily accessible and affordable, even free, community spaces are important for promoting community cohesion and inter-cultural communication. In providing these spaces it is important to ensure that they are not hogged by one ethnic or age group to the exclusion of others.
Empowerment and community capacity. Community apathy and over-consultation, with no results, leads many to avoid community consultation or engagement. When people feel that they have no influence over the processes, they feel disempowered and then don’t get involved. Efforts therefore need to be made to build local capacity and devolve power to the community to make decisions about their neighbourhood. Similarly, volunteering is important for the development of communities, but a lack of encouragement, resources, and capacity weakens the ability of local organisations to participate in activities that promote community cohesion.
(Bertotti, Adams-Eaton, Sheridan & Renton, 2016).
1.5. Systems to achieve social cohesion
According to the Australian Human Rights Commission there are five elements for achieving social cohesion within a country.
1.5.1. Government needs to be ready
A socially cohesive society is not achieved overnight. It takes time, and therefore requires from government a long-term commitment to build social cohesion and then to sustain its implementation. Key steps include:
Establishing a measure or benchmark capable of measuring progress towards social cohesion on a regular basis.
Placing social cohesion at the forefront of government priorities by using strategic planning to align the country’s policies and actions therewith.
Assessing the country’s readiness and capacity to build social cohesion.
Embedding social cohesion objectives in all policies and processes.
(Australian Human Rights Commission, 2015).
1.5.2. Communities need to be regularly engaged in order to understand the issues
Government needs to understand their communities and where there is potential for tensions to arise between different groups. They need to:
Know their community in order to understand the characteristics of society and how it may change over time.
Engage the community in order to identify the existing or potential areas that can strengthen and build social cohesion.
Ensure that all voices are heard.
Continually identify issues and tensions that could undermine social cohesion.
(Australian Human Rights Commission, 2015).
1.5.3. Long-term partnerships need to be established
Building social cohesion requires strong partnerships with business, community groups, the police, all spheres of government, and agencies, such as the Constitution’s Chapter 9 institutions. In doing this, government needs to:
Identify and understand which partners, across the range of sectors, could help build social cohesion.
Develop strategies to make contact and build and engage with the broadest possible range of social cohesion partners.
Work collaboratively with partners to identify issues of concern that need to be responded to and demonstrate that they are willing to lead and take action.
Ensure sustainable partnerships capable of existing for the long term by keeping in contact with the social cohesion partners and nurturing those relationships.
(Australian Human Rights Commission, 2015).
1.5.4. Take place-based, targeted action
Building social cohesion requires actions that meet the specific needs of the community. This means that:
Communities need to be empowered and capacitated to meaningfully participate in both the planning and implementation activities.
Government and their partners need to be prepared and ready to respond quickly to situations as they develop.
They need to target programmes that meet specific needs.
They need to engage and provide safe spaces for young people in order for them to feel connected to their community.
They need to support bystanders to effectively respond to racism.
Government needs to develop an effective media and communications strategy, with targeted messages to build social cohesion.
(Australian Human Rights Commission, 2015).
1.5.5. Evaluate and share outcomes
Government needs to continually evaluate their social cohesion efforts so as to ensure that resources are allocated efficiently and effectively, and that sufficient progress is being made in their social cohesion-building efforts. This requires them to:
Work with the community to develop an evaluation framework to measure the effectiveness and efficiency of their actions.
Collect appropriate data that will support the evaluation.
Regularly review the outcomes achieved in order to draw conclusions as to whether, and how, social cohesion has been influenced through their efforts.
Constantly share experiences so as to help others and to learn from the outcomes and processes deployed to achieve their results.
(Australian Human Rights Commission, 2015).
1.6. Conclusion and motivation for study
Measured against the backdrop of the aforementioned desktop review, it is manifestly clear that there is still a material social cohesion deficit in South Africa, and that the country’s reconciliation and nation-building aspirations remain unfulfilled.
1.6.1. In terms of definition of social cohesion
In terms of the definition, there is still substantial social conflict, in terms of wealth, ethnicity, race, and gender. For example, in the recent rioting and looting in KwaZulu-Natal, racial tension between the Indian and black communities in Phoenix raised its ugly head (Naidoo & Nkosi, 2021). There are also regular xenophobic incidents, such as the murder of more than 200 foreign truck drivers in recent years (Ryan, 2021). And there has been a significant rise in gender-based violence (Bosch, 2021).
1.6.2. In terms of the elements of social cohesion
With regard to the elements of social cohesion – inequality, trust, and identity:
With a Gini coefficient of 63, according to the World Bank, South Africa is the most unequal country in the world (Warah, 2021).
A 2019 South African Reserve Bank report suggests “South Africans have relatively low levels of trust in the state” (Moosa, N.d.).
The dominance of a racial identity has prevented the forging of a truly common identity (Allie, 2021).
1.6.3. In terms of the determinants for social cohesion
South African society is negatively driven by all the determinants required for social cohesion:
Racial diversity: The racial segregation caused by apartheid is well-documented.
Economic inequality: As previously mentioned, the World Bank has found South Africa to be the most unequal in terms of income inequality.
Education: The school drop-out rate is between 37 and 42 percent (BusinessTech, 2020).
Historical events: Once again, the history of apartheid and colonialism and its devastating impact on South African society, is well-documented.
GDP: The South African economy has been stagnating for a prolonged period, and fails to deliver jobs (RSA, N.d.).
Subjective well-being: There is a stark contrast in the subjective well-being of the minority communities, especially the white and Indian communities, versus the black majority. There are also deep intra-community well-being outcomes (Neff, 2005).
Health: The disparity in health cover between the various race groups has already been alluded to.
1.6.4. In terms of the obstacles to social cohesion
All the defined obstacles to social cohesion remain in present-day South Africa:
Lack of community: A relatively recent study into community participation in Khayelitsha, found a lack of community participation due to impediments such as poverty among the community residents, and ineffective police response to crimes (Manaliyo, 2016).
Young people: Youth unemployment currently stands at 66,50 percent (Trading Economics, N.d.).
Lack of safety: Crime in South Africa remains at very high levels, with crime statistics showing that South Africa remains a “very violent country” (Gifford, 2021).
High levels of transience: Informal settlements have increased from around 300 in 2002 to 3200 in 2020 (Mbanga, 2020) and there are around four million migrant workers in South Africa (Stats SA, 2021).
Racism: For example, more than a quarter of a century into the new South Africa and the country has still not been able to shed race-based politics (Cilliers, 2021).
Language barriers: Since the post-apartheid desegregation of schools, for example, language continues to create learning challenges in the classroom. Many scholars now struggle with language as a learning barrier in the classroom (Friedman, 2019).
Lack of activities and information about activities: The South African president has himself lamented that poor communication between government and communities prevails. Using local government as an example, he said that the refraining complaint from citizens was their inability to make contact with their councillors (Ramaphosa, 2021).
Under-utilisation of community space: Shackleton and Gwedla (2021), attached to the Department of Environmental Science at Rhodes University, in their analysis of public green spaces in South Africa, found marked inequalities in its distribution and quality between neighbourhoods designated for different race groups during the colonial and apartheid periods, and that it “continues to be reproduced by the post-colonial (and post-apartheid) state”.
Empowerment and community capacity: One point to illustrate this is youth empowerment, which “has long been identified as a catalytic tool for tackling youth unemployment and other youth challenges”. But many factors hinder the expansion of such empowerment (DBSA, 2022). This is further illustrated in a master’s thesis by Phendu (2019), where he assessed the state of public participation in the Western Cape. He found, for example, that most ward committee members do not understand their roles and responsibilities. He proposed that the municipalities facilitated regular capacity building programmes with the view to increase ward committee awareness and understanding of municipal functions, systems, and procedures.
1.6.5. Motivation for undertaking the survey
To this end, the Inclusive Society Institute has embarked on the project to develop the Social Cohesion Index or Radar for South Africa, as previously mentioned. The survey covered in this report is a precursor to that index/radar, which will be designed around three main themes:
Demographic integration
Questions in the survey were designed to test the various demographic groups’ (race, religion, political party support, education, income, gender, and age) attitudes towards integration and trust in their fellow South Africans.
For all the reasons highlighted in the desktop review above, and given the historical context of the demographic segregation actively pursued by apartheid, to build a cohesive nation, the Inclusive Society Institute is of the opinion that breaking down the ‘silo effect’ is important for social cohesion.
Level of connectedness to the country
This part of the survey aimed at testing various demographic groups’ attitudes towards emigration.
South Africa has a severe shortage of skills and expertise. The economy can simply not afford to lose such skills and expertise on a large scale. In order to understand what social cohesion determinants are at play within the South African environment, the Inclusive Society Institute would like to establish the level of such risk and the drivers behind it.
Sense of community
This part of the survey aimed at testing various demographic groups’ attitudes towards socialising and working with their fellow citizens from within their communities and from across a range of demographic groups.
The Inclusive Society Institute is of the view that a sense of community is important, not only to bring about reconciliation and to promote nation-building, but equally so for purposes of security, safety, and to counteract destructive damage to community assets during times of protest and unrest.
1.6.6. Parting shot
It is hoped that this report will serve to further motivate public policymakers and civil society leaders to promote the building of social cohesion in South Africa to a greater extent, and that they move it up on their lists of priorities. This is equally important for purposes of promoting human fraternity, as it is for the sake of rejuvenating the country’s lagging economy.
2. Methodology
The research was undertaken in three parts. The research takes a pragmatic view; a concurrent mixed methods research design is employed in this study. This is an approach that involves the use of quantitative and qualitative methods within a single phase of data collection and analysis. This allows both sets of results to be interpreted together to provide a richer and more comprehensive response to the research questions (Saunders, Lewis & Thornhill, 2016). Similarly, Creswell & Creswell (2018) argue that mixed methods research design yields additional insight beyond the information provided by either the quantitative or qualitative data alone. The mixed-method also counterbalances the weaknesses associated with quantitative and qualitative approaches when used separately (Creswell & Creswell, 2018; Johnson & Onwuegbuzie, 2004; Saunders et al., 2016) and leads to greater confidence in the findings.
2.1. Desktop review
The first part involved a desktop review aimed at building an understanding of social cohesion: To develop a framework as to what it is, why it matters, and what the elements, determinants of obstacles are. Parallel to this, the author attempted to position the current-day South African social cohesion experience within this framework.
2.2. Survey
The second part involved an extensive survey, the Inclusive Society Institute annual GovDem Poll.
2.2.1. Questionnaire
The questionnaire for this study focused on the three elements of Demographic Integration, Level of Connectedness in the Country, and the Sense of Community.
Questions on these three elements were developed by Ipsos and submitted to the Inclusive Society Institute for approval.
2.2.2. The Ipsos Khayabus
The questionnaire was included in the Ipsos Khayabus questionnaire in 2021. The Khayabus is a syndicated study, undertaken twice a year by Ipsos to provide clients with the ability to pose questions to a large sample of South Africans, without carrying all the daunting fieldwork costs themselves. While each participating client pays for the administering of their own questions and receives their own results and the results of the included demographic questions, results are not shared freely, and the findings are treated confidentially to the client and belong to the client.
This process can be summarised graphically as follows:

2.2.3. Sampling
Stratified random sampling is designed by the Marketing Science team at Ipsos – the sample is firstly stratified by province and then within province by various sizes and types of settlements.
Sampling points are chosen at random, and six interviews are conducted in the vicinity of each sampling point, following the random selection rules as determined by the process of random sampling. On each plot/erf/farm, the household to be included is chosen by applying a prescribed random process and within the selected household the individual to be interviewed is also chosen by applying a random process.
This process is well-documented and conforms to the ISO standards, which are followed at Ipsos and regularly audited. The stringent rules are designed to ensure that all interviewers follow the same process and that interviewers do not have any influence on the eventual choice of respondent.
Marketing Science also produces the maps to enable interviewers to work in the chosen areas. The next graph is a summary of this process:

2.2.4. Interviewing
All interviews for the Ipsos Khayabus are conducted by trained and experienced interviewers. Interviews are conducted face-to-face in the homes and home languages of respondents. As a result of COVID-19, interviewers have to adhere to certain procedures:

This process ensures that results are representative of the views of adult South Africans and the results are projected to this universe/population.
2.3. Assessment tools
To enable an assessment as to the state of social cohesion in South Africa, two tables were developed from the information gathered in the desktop review. The first table allows for a somewhat subjective but informed assessment as to the state of social cohesion in South Africa, as tested against the elements, determinants of, and obstacles to social cohesion within society.
The second table draws from the empirical data gathered from a set of questions in the GovDem Poll survey that were designed to test respondent perceptions with regard to the extent of demographic integration (to what extent do South Africans socialise across racial lines), their level of connectedness (their commitment to South Africa as opposed to seeking a future outside of the country), and sense of community (an important element to ensure social stability and order).
2.4. Limitations of the study
In terms of the elements and determinants of, and obstacles to, social cohesion, whilst in some respects credible secondary data, such as GDP and unemployment, are readily available and adequate for drawing conclusions, in other respects the data are not. Especially as it relates to the obstacles to social cohesion, empirical data collected via the survey would have been more conclusive than having to rely on a subjective conclusion to been drawn from a desktop study. To this end, however, questions were not included in the survey. This can be corrected in future surveys.
3. Findings
3.1. South Africans remain committed to ‘unity in diversity’
Whilst nearly half of the South African population doubt whether the different groups in South Africa are able to form a single nation, they do believe that they can unite, and live and work together, as fellow South Africans. This was the first principal finding of the survey commissioned by the Inclusive Society Institute.
3.1.1. Doubt as to whether one nation can be formed from amongst the different groups
47,96 percent (nearly half) of South Africans either agreed or strongly agreed with the notion that it is not possible to form one nation out of all the different groups in the country. This finding held true across all race groups, with whites being slightly more inclined to believe it possible, and coloured people being the most doubtful. 42,7 percent of white South Africans thought is not possible to form one nation, whilst 47,45 percent of black South Africans, 54,55 percent of Indian and 55,77 percent of coloured South Africans also thought so.
On the opposite side of the divide, 31,44 percent of South Africans disagreed with the notion that it was impossible to form one nation out of the different groups in the country. Stated otherwise, these respondents therefore believed that it was possible to form one nation in South Africa. 15,36 percent of South Africans did not express an opinion either way.

Figure 3.1.: Percentage of South Africans who are doubtful one nation can emerge
The more educated they were, the more optimistic they were that one nation can emerge from the different groups in the country. Indeed, there is a large differentiation between those with higher education and those without. 40,45 percent of South Africans with higher education were of the opinion that it is impossible to form one nation, whilst this hovered at around 50 percent for less educated South Africans (No schooling: 49,85%, Some high schooling: 50,95%, and those with Matric: 51,09%).
There was little differentiation between gender and age groups.
However, this did not mean that various race groups were not willing to come together within a diverse, but unified country. Indeed, a minority of South Africans were of the view that race relations in the country were getting worse. Only 29,63 percent of South Africans were of the view that the relationships between the different races in the country were getting worse. 70,37 percent were of the view that the relationships either remained the same (47,64%) or were improving (22,37%).
In this regard, 73,55 percent of whites believed that the relationships either remained the same (47,04%) or were improving (26,51%). 70,57 percent of black South Africans believed that the relationships either remained the same (47,76%) or were improving (22,81%). And amongst Indians it was 67,66 percent of the view that relationships were either remaining the same (50,77%) or improving (16,89%). 66,11 percent of coloureds said that the relationships either remained the same (46,38%) or were improving (19,73%).

Therefore, the survey seems to suggest that whilst across all races two-thirds or more did not suggest a regression in race relations, they were of the view that a South African construct would not necessarily comprise a single nation, but rather a conglomeration of groups capable of working together under a common South African identity.
3.1.2. But most agree South Africa must unite
Most were of the opinion that it was important for all South Africans to unite. 70,53 percent of South Africans either agreed or strongly agreed with this notion, whilst only 13,15 percent either disagreed or strongly disagreed. 2,75 percent did not know.
In this regard it was the Indian (80,75%) and coloured (80,76%) South Africans who, in terms of agreeing or strongly agreeing, registered the highest level of concurrence, followed by whites at 75,65 percent and trailed by blacks at 68,24 percent.

Figure 3.2.: Percentage wanting South Africa to unite
3.1.3. More agree than disagree that reconciliation is moving in the right direction
Whilst the majority of South Africans do not “yet” believe that reconciliation is moving in the right direction, it is encouraging that those who do agree outnumber those who don’t by a significant margin. 44,97 percent of South Africans agree or strongly agree that it is moving in the right direction, as opposed to 27,54 percent who disagree or strongly disagree. 21,27 percent neither agreed nor disagreed, and 6,22 percent did not know how they felt about it.
In terms of racial breakdown of the responses, 43,39 percent of whites felt positive about the direction, 46,06 percent of blacks felt positive, and 40,51 percent of coloureds felt that reconciliation was moving in the right direction. At 35,62 percent, Indian South Africans trailed somewhat in this regard. One explanation could be that the survey was in the field at the time of the rioting and looting in eThekwini, during which period there was racial tension in the Indian suburb of Phoenix.
Apropos reconciliation moving in the wrong direction, at 27,48 percent and 26,92 percent for white and black South Africans respectively, there was not much between them. Indian and coloured South Africans were slightly more negative, registering 33,05 percent and 31,00 percent respectively.

Table 3.1.: Reconciliation moving in the right or wrong direction indicated by race
3.1.4. High level of racial integration in everyday life
The survey suggests that there is a relatively high level of integration between the various race groups in the country when it comes to everyday life activities. Moreover, the integration appears not be forced integration, but rather of a voluntary nature, as can be deduced from the table 3.2 below, where there was a high level of enjoyment flowing from such integration and friendships being formed.

Table 3.2.: Level of everyday life integration indicated by race
Table 3.2 above shows that across the various activities, a majority of the population is integrating as it relates to everyday life activities. Even more encouraging is the trend that replicates itself across all the racial groups.
Whilst the hard statistics indicates that the black community is slightly lagging in terms of integration, this should be understood within the socio-economic context of South Africa, where the majority of the poor and jobless are black and thus not within the workplace or able to participate in extra-mural social activities to the same extent as the employed and socially mobile. This is corroborated by the results of the survey, which shows that in terms of having friends from different population groups, high-income earners (at 61,05%) are around 6 percentage points ahead of the overall results; and in terms of entertaining friends from different population groups, high-income earners (at 57,86%) are similarly nearly 4 percentage points ahead of the overall average.
What the statistics do tell us, is that the majority of South Africans have commenced the journey towards reconciliation, nation-building and social cohesion.
3.1.5. But, whilst on the decline, racial bias is still alive and kicking
Nearly a third (33,44%) of adult South Africans still do not like associating themselves with people from other population groups. This would suggest that the country has still some way to go before it can consider itself to be fully reconciled. It is a high percentage that cannot be left unchecked, lest it festers to the detriment of the vast majority who the survey statistics suggests are committed to building a united, non-racial South Africa.
When asked to indicate whether they like associating with people from other population groups, the results show that whites are quite open to it, while Indians feel very differently on the matter. Once again, it is worth mentioning that the survey was done during the period which saw racial tension in the Indian suburbs of Phoenix. This may have had some impact on the results.
28,3 percent of whites indicated that they do not like associating with people from other population groups. Similarly, 33,88 percent of blacks, 41,73 percent of Indians and 33,05 percent of coloureds indicated that they do not like to associate with people from other population groups.

Figure 3.3.: Percentage against association with other racial groups
3.1.6. Conclusion
South Africa still has a long way to go on its journey towards full reconciliation. The results from this survey show, however, that much progress has been made, with more in the country committed to uniting the country, than dividing it.
Most striking is the disconnect between the general negative political racial narrative which drives division, and the realities of everyday South Africans going about their daily business. Whilst many in the political establishment seem to be fuelling division, citizens, in turn, are finding each other at the human level. Politicians would be well advised to focus equal energy on a narrative that aims to build the nation.
What still appears unresolved is a national understanding as to the concept of Unity in Diversity and how it relates to the nation we wish to build. Can one nation with an undefined racial identity be formed out of the different population groups, or will it be a nation of cultural cooperation? This question is central to understanding the dichotomy of the survey results, which point to both doubt that one nation can be formed out of the different groups and the strong desire to unite the nation. This is a concept worthy of finding national consensus on in order to develop a unified path for all in the country.
3.2 South Africa has worrying trust issues
The trust needed to underpin social cohesion in South Africa is largely absent. South Africans do not sufficiently trust their fellow compatriots. The lack of trust runs across most dimensions, be it race, gender, age, education, or income. It is only the family unit which seems to be holding. This was the second principal finding of the Institute’s survey.
3.21. High trust in family
87,42 percent of South Africans trust other members of their family. This holds true across all racial groups, with more than 85 percent of South Africans of all racial groups indicating that they completely trust or somewhat trust members of their family. The highest level of trust within the family was recorded amongst the whites (90,68%), with the coloureds recording the lowest (85,47%). The level of trust recorded amongst blacks was 87,21 percent, and amongst Indians, 88,19 percent.
There was little differentiation based on gender, education, or income considerations.
87,82 percent of men completely or somewhat trust their family members, whereas 87,04 percent of women do.
Those with no schooling or some schooling are slightly less trusting than those who have completed matric or who have a higher education (no education: 83,14%; some schooling: 83,97%; matric: 89,93%, higher education: 85,55% completely trusted or somewhat trusted their family).
Those with no income recorded an 82,54 percent complete trust in or somewhat trust in their family members, 86,89 percent of those in the lowest income band indicated that they completely trusted or somewhat trusted their family, the mid-income group 87,75 percent, and the highest income group 86,73 percent.


Figure 3.4.: Differentiation based on gender, education, or income considerations
3.2.2. Reasonable trust in neighbours
From the results of the survey, it is apparent that people have a reasonable level of trust in people within their own neighbourhoods. Overall 62,27 percent of South Africans indicated that they either completely or somewhat trusted their neighbours. However, there were sharp differences amongst the various demographic groups.
Racial demographics
Whites and Indians have a higher level of trust in their neighbours as measured against their black and coloured compatriots. In this regard 72,95 percent of white South Africans indicated that they completely trusted or somewhat trusted their neighbours. 77,54 percent of Indians indicated such. On the other end of the spectrum this percentage came down to 60,6 percent amongst black South Africans and 60,1 percent amongst coloureds. Thus, a material difference of more than ten percentage points between the former two and latter two groups. This may warrant deeper analysis in future studies.
Age demographics
The older people get, the more they trust their neighbours. Whereas 58,33 percent of those South Africans in the age group 18-24 indicated that they completely or somewhat trusted the people in their neighbourhoods, this rose sharply to 67,74 percent for those over fifty years of age. For South Africans within the age groups 25-34 and 35-49, the percentages came in at 59,84 percent and 63,44 percent respectively.
Education demographics
In general, there is little difference in the level of trust of neighbours whether South Africans are educated or not. For those with no schooling, 64,63 percent indicated that they either completely or somewhat trusted their neighbours. Whilst for those with some high schooling it came down quite sharply to 56,75 percent, it again rose to 63,6 percent amongst South Africans with matric and 63,56 percent amongst those with a higher education.
Income demographics
Lower income earners trust their neighbours significantly less than higher income earners. For South Africans with no household income, only 59,5 percent indicated that they either completely or somewhat trusted their neighbours. This rose sharply to 65,58 percent amongst the highest income grouping. For those in the lower income and middle-income groupings, it was 55,17 and 61,48 percent respectively.


Figure 3.5.: Trust of neighbours based on race, age, education, and income
3.2.3. Trust improves as people get to know each other
From the results of the survey indicated in the table below, it is apparent that South Africans do not trust people at first sight. It is only after relationships are built, and people have gotten to know one another, that trust develops.
There is little differentiation to be made amongst the gender and education demographic groups, but there is quite a stark difference based on race and income. Younger people also take somewhat longer to trust their fellow compatriots than do older people.

Table 3.3.: Trust differentiation between persons known and met for the 1st time
3.2.4. Distrust high amongst religious groups
Less than half of South Africans indicated that they completely or somewhat trust people from religious groups other than their own. Overall, only 47,1 percent indicated that they did (48,68% of males and 45,70% of females).
There are no stark differences between the various demographic groups, although it does appear the more one is educated and earns, the more inclined one would be to trust people from other religions. That said, the difference is only marginal.
The most prominent demographic differentiation is that black South Africans indicated a somewhat greater censure of those from religious groups other than their own. Whilst only 45,36 percent from this group completely or somewhat trusted people from other religious groups, those from the white and Indian demographic groups registered just over 50 percent. Those from the coloured community, at just under 55 percent, were most trusting.


Figure 3.6.: Trusting those from other religions
3.2.5. Distrust between races still worryingly high
Only around 50 percent of those South Africans from the minority communities indicated that they completely or somewhat trusted people from the black community. For those from the white and coloured communities it was just over 50 percent (50,69% and 51,21% respectively).
The distrust was somewhat higher amongst the Indians, where only 43,92 percent indicated that they completely or somewhat trusted black South Africans. It should, however, be mentioned that the survey was undertaken at a time of unrest and tension between some Indian and black communities in KwaZulu-Natal, the home of most Indian South Africans. This may have to a degree impacted the results.
More alarming was the high level of distrust that the black South Africans have for their compatriots from the minority communities. In this instance, only 41,07 percent of the blacks completely or somewhat trusted their white compatriots, which deepened to only 38,93 percent completely or somewhat trusting their coloured compatriots, and a mere 34,84 percent their fellow Indian South Africans.
Complete or somewhat trust for black South Africans from:


Figure 3.7.: Trust for black South Africans
Complete or somewhat trust for white South Africans from:


Figure 3.8.: Trust for white South Africans
It is worth noting that, as can be deduced from the aforementioned graphics, the trust-deficit between the minority communities is also not at an optimal level.
Similarly, it is worth mentioning that the in-group level of trust is not at optimum levels either. For example, black respondents when asked to what extent they trust their fellow black South Africans, only 54,46 percent indicated that they completely or somewhat trusted their fellow black compatriots.
Indian and coloured respondents were somewhat more trusting of people from their group. In this regard 59,97 percent of the Indian respondents indicated that they completely or somewhat trusted their fellow Indian compatriots, whilst this grew to 62,97 percent within the coloured group.
The most cohesive group appears to be the white community, since 74,51 percent of white respondents indicated that they completely or somewhat trusted their fellow white South Africans.

Figure 3.9.: Comparison with regard to in-group trust
3.2.6. Conclusion
Trusting one’s fellow compatriots is crucial for the establishment of social cohesion in a country. Social cohesion is also hugely important for economic development. Sadly, there are worrying trust-deficit trends within South African society.
But for high levels of trust within families, disquieting trends endure across all other dimensions. Whilst people have reasonable trust in their neighbours, and whilst they grow to trust people who they have gotten to know, they highly distrust people they do not know. There are also disturbingly high levels of distrust amongst people from different religions and races, also with high levels of in-group distrust in the latter.
The current South African society and its economy is rather fragile. It requires a national effort to unite the nation and rebuild the shattered economy. The part that social cohesion is to play in this must not be underestimated.
Leaders of society should refrain from divisive narratives and other actions that undermine trust. Its replacement with language and deeds that create unity and confidence, will help.
3.3. Emigration could reduce South Africa’s skilled workers by 11 percent
The third principal finding of the survey was that emigration is a material risk to the South African economy. 11,13 percent of South Africans with higher education indicated that they were seriously considering emigrating to another country in the next year or two. For a country that is already experiencing a skills shortage, it would be a serious blow to the economy should an exodus of the magnitude suggested, materialise.
The trend is confirmed when cross-correlating the results of South African incomes, where 10,35 percent of the top earners indicated that they were seriously considering emigrating in the next year or two.
3.3.1. Similar trends across race groups
It appears that race is not a material driving force behind the motivation to emigrate, since similar trends are found across all the race groups. Whilst white South Africans, at 11,72 percent, reflected a slightly higher desire to emigrate, they were closely followed by their black, Indian and coloured compatriots. Just under 10 percent of black (9,73%) and Indian (9,69%) South Africans suggested that they wanted to emigrate. Though only 8,96 percent of coloured South Africans signalled their intention to emigrate, there is less than a percentage point between them and their black and Indian compatriots.

Figure 3.10.: Percentage of population considering emigration – by race
3.3.2. Opportunity: the driving force
South Africans indicating their intention to emigrate, were mainly driven by economic and personal well-being considerations. Three of the top five reasons for emigration suggested this. 24,26 percent of South Africans (25,68% of those with higher education and 32,91% of high-income earners) cited better job opportunity as the rationale for their consideration, whilst 8,36 percent suggested overall better opportunity and 5,42 percent cited a better life / standard of living as the reason. Corruption also weighed heavily in their decision (6,71%), as did their desire to experience different societies, cultures, and lifestyles (5,13%).
The underlying motivation for the latter was not measured. In considering the overall poll, it may however be deduced that at its core is their inability to achieve self-fulfilment in the current South African environment.

Figure 3.11.: Top 5 reasons for emigrating
3.3.3. Younger people are the most vulnerable group
As may be expected, given the high youth unemployment statistics and greater flexibility of younger people to emigrate (e.g., single, early stage of career, still building asset base), the aspiration to emigrate seems to reduce the older people become. In this poll it proves to be significantly so. South Africans in the 18–24-year-old category considered emigrating more than three times that considered by those over the age of 50.
The results of the survey show that as people get older, their intention to emigrate declines. In the category 18-24 years, 15,91 percent were considering emigration. In the category 25-34 years, it reduced to 11,25 percent. In the category 35-49 years this went down to 8,06 percent. And in the category 50 years and older it was 4,76 percent.

Figure 3.12.: Percentage of population considering emigrating – by age
3.3.4. Top five emigration destinations
It is mainly developed economies, and English-speaking countries, that seem to appeal to those considering emigration. The outlier is Germany, which came in third, but which, at a ratio of 2:1, is favoured more by white and coloured South Africans than their black compatriots. No Indian South Africans chose Germany as a potential emigration destination. This could possibly be due, in part, to Afrikaans having its roots in the Germanic language, which makes it easier for Afrikaans speakers to assimilate in Germany than other language groups. Also, in modern times, English is widely used in Germany.
The top five emigration destinations are indicated in table 3.4 below:

Table 3.4.: Top five emigration destinations
3.3.5. Conclusions
South Africa is at risk of losing up to ten percent of its working-age population. Of even greater concern is the number of educated and high-income earners considering emigration. For any economy to lose ten to twelve percent of its qualified workforce is problematic, more so in an economy such as ours, which lacks skills and expertise.
The risk is real. The South African economy is not providing enough job opportunities for the educated and high-income earners to grow. This against a backdrop of developed economies – including those favoured most by South Africans – that have a qualified jobs deficit and are actively seeking especially qualified individuals to relocate to their shores.
The driving motivation behind emigration from South Africa appears, in the main, to be economic and wellbeing opportunity. There is little evidence in the survey to suggest that politics, race, and/or cultural assimilation play much of a role in emigration decisions. Only 1,76 percent of South Africans identified political issues/systems/instability as a motivator.
The inherent danger that emigration holds for the current stagnant and job-losing South African economy, is that it is also driving the qualified abroad, which in turn, because of the skills deficit in the economy, further reduces its ability to perform optimally. And optimal performance is needed to expand GDP and employment growth.
3.4. South Africans don’t sufficiently trust immigrants
In general, there is not enough trust in South Africa to sufficiently underpin social cohesion. What has emerged as an alarming trend, is the extreme lack of trust that South Africans have in foreigners, be they from Africa or other overseas countries. This is particularly important to take note of, given the sporadic incidents of xenophobia in the country. The lack of trust runs across most dimensions, be it race, gender, age, education, income, or political party. This was the fourth principal finding of the Inclusive Society Institute survey.
3.4.1. Immigrants from Africa
Overall, only 31,23 percent of South Africans said they completely trusted or somewhat trusted immigrants from African countries, with only a slight differentiation between men and women. 62,62 percent of male and 62,63 percent of female South Africans either did not trust immigrants very much or at all.
Based on race
The results of the study made it clear that the Indian and coloured communities in South Africa were slightly more trusting of immigrants from Africa. 57,9 percent of Indians and 54,87 percent of coloured South Africans indicated that they did not trust immigrants from Africa very much or at all. This increased to 62,61 percent and 63,76 percent of white and black South Africans respectively.
Based on education
The survey results suggest, however, that the more educated South Africans are, the more they are willing to trust African immigrants. 68,27 percent of South Africans with some high schooling either did not trust immigrants very much or at all. For those that had matric it improved to 62,24 percent, and for those with higher education it was 59,71 percent.
Based on age and earnings
There is little differentiation to be made based on age, with all age bands recording a distrust (not very much or no trust) in the lower 60 percent range. Similarly, earnings did not appear to make much of a difference in South Africans’ attitudes.
Based on political party support
Amongst supporters from the various political parties, those from the FF+ emerged as the most trusting (with only 45,34% either not trusting very much or at all) and the IFP the least trusting (88,95%). Amongst the three largest parties, although still alarmingly high, the ANC was the most trusting, whilst the EFF was the least. 59,57 percent of ANC supporters, 67,15 percent DA and 68,67 percent of EFF supporters either did not trust immigrants from Africa very much or at all.

Figure 3.13.: Percentage of South Africans not trusting African immigrants – based on party affiliation
Based on provinces
Bearing in mind recent xenophobic incidents that sporadically flared up in, particularly, KwaZulu-Natal (KZN) towards the end of 2020 and into 2021, it was KZN that, when measured at a provincial level, emerged as the most distrustful of immigrants from Africa. 79,68 percent of South Africans from KZN either did not trust immigrants from Africa very much or at all. For the other provinces, the results are indicated in the chart below.

Figure 3.14.: Percentage of South Africans not trusting African immigrants – based on provinces
3.4.2. Immigrants from outside of the African continent
Overall, only 32,29 percent of South Africans said they completely trusted or somewhat trusted immigrants from countries other than those in Africa, with only a slight differentiation between men and women. 61,03 percent of male and 61,13 percent of female South Africans either did not trust immigrants very much or at all.
Based on race
The results of the study made it clear that the racial minority groups in South Africa were more trusting of immigrants from outside of Africa, than were their black compatriots. 54,23 percent of white South Africans, 55,41 percent of Indian South Africans, and 51,61 percent of coloured South Africans indicated that they did not trust immigrants from countries outside of Africa very much or at all. This increased to 63,37 percent of black South Africans.
Based on education
Once again, the survey results suggest that the more educated South Africans are, the more they are willing to trust immigrants. 66,64 percent of South Africans with some high schooling either did not trust immigrants from countries outside of Africa very much or at all. For those that had matric it improved to 60,32 percent, and for those with higher education it was 57,97 percent.
Based on age and earnings
There is little differentiation to be made based on age, with the trend for all age bands recording a distrust (not enough or no trust) in the lower 60 percent range. Similarly, earnings did not appear to make much of a difference in South Africans’ attitudes.
Based on political party support
Amongst supporters from the various political parties, those from the FF+ again emerged as the most trusting (with 47,79% either not trusting very much or at all) and the IFP the least trusting (90,37%). Amongst the three largest parties, although still very high, the ANC and DA were neck-and-neck as the most trusting, whilst the EFF was the least. 59,84 percent of ANC supporters, 59,37 percent DA, and 67,36 percent of EFF supporters either did not trust immigrants from countries outside of Africa very much or at all.

Figure 3.15.: Percentage of South Africans not trusting non-African immigrants – based on party
Whilst supporters from all parties other than the DA appear not to make much of a differentiation between immigrants from within or outside of Africa, the DA supporters were, by quite a large margin, more favourably disposed towards immigrants from outside of Africa, than they were towards those from within Africa. 68,24 percent of DA supporters indicated not very much or no trust in immigrants from Africa, but this figure dropped to 59,39 percent with regards to distrust for those immigrants from outside of Africa.
Based on provinces
Provincial responses are indicated in the chart below. From a provincial perspective, the same trends remain, more or less, true, for immigrants from outside of Africa as they do for those from within Africa.

Figure 3.16.: Percentage of South Africans not trusting non-African immigrants – based on provinces
3.4.3. Conclusion
In general, there is a low level of trust between South Africans, from across all demographic groups, be it race, gender, age, education, income, political party, or province, and immigrants. This does not bode well for social cohesion and presents a socio-political risk within an environment which is prone to xenophobic confrontation.
The authorities would do well to heed these warning signs and to ensure that social interventions are undertaken to improve relationships between the local and immigrant communities. This should be particularly high on the Kwazulu-Natal agenda, although there are other provinces such as Gauteng, the Eastern Cape, and Mpumalanga where the levels of distrust (not very much or no trust) are also worryingly high.
Whilst the general trend holds true for all South Africans not having a strong level of trust in immigrants, be they from Africa or outside of Africa, the notable differences are:
South Africans from the minority race groups are significantly better disposed towards immigrants from outside of Africa, than those from within Africa.
Whilst South African supporters from all political parties, bar the DA, have a similar disposition towards immigrants from both within and outside of Africa, the DA supporters are significantly better disposed towards immigrants that are from outside of Africa, than those from within Africa.


Figure 3.17.: Comparison of distrusting South Africans based on race and party-political affiliation
3.5. South Africans deeply distrust their compatriots from other parties
South Africans deeply distrust fellow compatriots who do not belong to the same party as their own. This undermines social cohesion, and points to a high level of political naïveté, in that in a mature democracy people should be able to associate freely at the personal, workplace, and societal level without overt hostility toward those who differ politically. This is particularly unsettling given the country’s past racial divisions, and party support that remains largely divided along racial lines. This needs to be overcome in order to achieve social cohesion and to build a united nation.
This was the fifth principle finding of the Institute’s survey.
3.5.1.
No party instils trust amongst a majority of South Africans
Evidence suggests that South Africans do not trust fellow compatriots who do not share the same political conviction as themselves. This appears to hold true across all demographics, be it gender, age, income, or race. In examining the attitudes of South Africans drawn from the three largest political parties in parliament, it was found that, across all parties, the majority did not trust fellow South Africans who did not share their own political convictions. Only 43,26 percent said that they could completely or somewhat trust people who supported the ANC, whilst this dropped to 33,2 percent for the DA and 32,39 percent for the EFF.
Based on gender
In all instances, as is indicated in the table below, generally speaking, there was little differentiation to be drawn between the attitudes of South African men and women in this regard. Slightly more of those who could completely trust or somewhat trust supporters of the EFF, were men.

Table 3.5.: Trust in people from other parties – based on gender
Based on age, education, race, and income
In terms of age, whilst older South Africans were marginally more inclined to completely or somewhat trust their fellow South Africans from the ANC and DA, their willingness to completely or somewhat trust people from the EFF dropped significantly.

Figure 3.18.: Percentage of people willing to trust compatriots from other parties – based on age
The more educated they were, the less they completely or somewhat trusted their fellow South Africans from the ANC. On the other hand, the more educated, the more they were prepared to completely or somewhat trust people from the DA. For the EFF, there were more South Africans with matric who could completely or somewhat trust people who support the EFF, than those with either only some education or with higher education.

Figure 3.19.: Percentage of people willing to trust compatriots from other parties – based on education
In terms of race, the ANC and EFF continue to suffer a material trust-deficit amongst the minority communities, whilst the DA continues to enjoy high trust amongst them. Whilst an outright majority of white and coloured South Africans indicated that they completely or somewhat trusted people who supported the DA, they do not trust supporters of the ANC or EFF in any significant numbers. Indian South Africans nudge towards a majority trusting DA supporters.
However, most blacks indicated that they did not completely or somewhat trust their fellow South Africans who supported any of the parties. 48,35 percent of black South Africans indicated that they completely or somewhat trusted people who support the ANC. The DA and EFF were way off the mark with only 26,71 percent of black South Africans indicating that they completely or somewhat trusted people who support the DA, whilst for the EFF it was 36,63 percent of black South Africans.

Figure 3.20.: Percentage of people willing to trust compatriots from other parties – based on race
In terms of income, the same trend of not trusting people from the ANC or EFF was, to a large degree, evenly spread amongst all income groups, whilst it appears that the higher the income of South Africans, the more they were able to trust DA supporters.

Figure 3.21.: Percentage of people willing to trust compatriots from other parties – based on income
3.5.2. All parties enjoy a high percentage of trust amongst their own supporters
All three of the parties can take solace from the fact that they enjoy high trust (that is complete or somewhat trust) amongst those who support them. More than two-thirds of those South Africans who indicated that they support either the ANC or DA, also indicated that they completely or somewhat trust their fellow DA supporters. Whilst the EFF fell short of the two-thirds mark, at 63,61 percent they came close.

Figure 3.22.: Percentage of people trusting supporters of the same party
3.5.3. But inter-party trust is completely lacking
From the responses recorded, it would appear that South Africans who indicated that they support a particular party, completely or somewhat trust other people from that same party, but they do not completely or somewhat trust people from either of the other two parties. Trusting people from a party other than one’s own appears not to be a feature of the South African political environment.

Figure 3.23.: Percentage of South Africans willing to trust those from other parties
3.5.4. Conclusion
There appears to be a high level of distrust between the supporters of the various political parties, with the majority of supporters from all parties not being able to completely or somewhat trust their fellow South Africans who supported a different political party.
Social cohesion requires citizens to work together and live contently and peacefully amongst their fellow citizens, regardless of their political, religious, or other differences. To this end, a high level of community trust in one’s fellow citizens is required.
The survey results suggest material distrust amongst the supporters of the various political parties in South Africa. This poses a risk to social cohesion which political and civil society leaders should take note of and urgently act upon, by factoring it into a more reconciling national narrative.
3.6. High sense of community provides solid foundation on which to build social cohesion
Social cohesion requires a high sense of community. It is when a community is socially invested in each other that they will come to the defence of its people, its institutions, and infrastructure in times of need, threat, or tragedy. Furthermore, economists find a positive relationship between social cohesion and economic growth, on the basis that social cohesion improves formal and/or social institutions, which causally drives economic growth (DIE, 2019).
In the survey, the sixth principal finding was that there is a high sense of community prevailing in South African society. This positive finding provides a solid foundation on which to build social cohesion in individual communities and the country as a whole.
3.6.1. People are involved in the communities
75,07 percent of South Africans agreed that it is important to get involved in the community where one lives. This sentiment was shared across all demographics, that is gender, age, education, income, political party support, and race.
Gender
Male and female South Africans were within one percentage point of each other, with 75,49 percent of males and 74,68 percent of females agreeing that it is important to get involved in one’s own community.
Age
Across all age groups there was a high degree of agreement that it was important to get involved in one’s own community. The commitment to get involved increased as people got older. In the age group 18-24, 72,29 percent agreed, for the 25-34 age group it increased to 74,66 percent, further rising to 75,88 percent for the age group 35-49, and peaking at 77,13 percent for the 50 years and older group.

Figure 3.24.: Percentage of South Africans getting involved in the community – based on age
Education
68,69 percent of South Africans with a higher education agreed that it was important for people to get involved in their local communities. Although high, this was significantly lower than those with no schooling to matric, amongst whom there was little differentiation. For those with no schooling, 77,44 percent were of the opinion that it is important to get involved in one’s community. For those with some high schooling it was 78,35 percent, and for those with matric, it was 77,48 percent.

Figure 3.25.: Percentage of South Africans getting involved in the community – based on education
Income
The lower the income, the higher the belief that it is important to get involved with one’s community, although the difference was marginal. For those South Africans in the low-income band, 79,93 percent were in agreement, for those in the middle-income band, it was 77,83 percent, which came down to 73,32 percent within the high-income band.

Figure 3.26.: Percentage of South Africans getting involved in the community – based on income
Race
Whilst white and black South Africans were neck-and-neck at 74,14 percent and 74,04 percent respectively, the Indian and coloured South Africans in turn were neck-and-neck, but to a significantly higher degree. Indians recorded 82,92 percent agreement and coloured South Africans 82,16 percent agreement with the belief that they should get involved in their communities.

Figure 3.27.: Percentage of South Africans getting involved in the community – based on race
Political party
Supporters of all parties recorded a high level of agreement with the notion of getting involved in their communities. 90,38 percent of the IFP supporters agreed therewith; and the ANC (80,69%) and DA (81,31%) supporters, also agreed with a significantly higher margin than did those from the EFF (75,38%) and FF+ (71,22%).

Figure 3.28.: Percentage of South Africans getting involved in the community – based on party support
3.6.2. Money or active involvement?
50,22 percent of South Africans said they donated money to welfare and/or community organisations, whilst 44,69 percent opted for active work within those welfare and/or community organisations.
Gender, age, education
There was little differentiation to be made between the giving patterns of the various gender, income, and education groups.
Race
Here, in terms of donating money to local welfare and/or community organisations, the minority communities gave to a significantly greater extent than their black compatriots. The Indian community placed a particularly high premium on this. In terms of working actively for the welfare and/or community organisations, the white, black, and coloured South Africans also tracked each other at a significantly lower level than their Indian compatriots. This is illustrated in the table below:

Table 3.6.: Comparative chart on giving patterns of the different race groups
3.6.3. Community organisations should get more support from local government
67,38 percent of South Africans indicated their belief that community organisations should get more support from local government. There was little differentiation between all demographic groups.
3.6.4. Conclusion
A high sense of community is as important for the economy as it is for social cohesion. The result of this survey suggests that this is indeed a feature of South African society. Communities across the country are highly involved in their local welfare and/or community organisations. The trend also holds true across all demographic groups, be they based on gender, age, education, income, race, and/or political party support.
The Indian community in particular seems to be highly committed to supporting their local communities, both in terms of donating money and getting involved in the work of the community organisations. In fact, according to the principles of the Quran, Muslims are expected to make a contribution to welfare and donations – it is part of their religion.
In terms of the importance placed on getting involved in community life, older people seem slightly more committed than younger people, possibly due to them having more spare time. On the other hand, the wealthier and more educated people are significantly less involved in the local communities, which one could speculate is due to time pressures. Wealthier individuals of course also make a considerable contribution to social wellbeing as taxpayers through the fiscus.
What has not been tested, is the extent to which community work takes place across community lines. In terms of social cohesion this is an important element that will need to be tested in future surveys.
Given the far-reaching in-bedded potential of working with community organisations, public policymakers will be well-advised to explore deeper ways of partnering with local community organisations in the execution of their social programmes. In the community there is a sense that in this regard, more can be done.
4. Further discussion, assessment, and recommendations
In this section we discuss in a summarised manner the findings of both the literature review into the elements, determinants and obstacles of social cohesion from the desktop study and that of the extensive GovDem Survey undertaken by the Inclusive Society Institute towards the end of 2021.
In Table 4.1. below, we evaluate social cohesion mainly from the perspective of the characteristics of social cohesion as discovered in the literature review. In certain respects, we have added the findings of the survey as further motivation for our interpretation. Where the evidence, in our view, points to conditions that are conducive to promoting social cohesion, it has been recorded as a positive (+). And where the evidence, in our view, points to conditions that are not conducive to promoting social cohesion, it has been recorded as a negative (-). The interpretation may be somewhat subjective in nature but is adequately corroborated within the detailed findings reported on in section 2 and 3 of this report.
None of the elements or determinants required for social cohesion are being adequately met, and only one of the eight obstacles to social cohesion is being met (albeit that the detailed findings suggest room for improvement).

Table 4.1.: Assessment of conditions that promote social cohesion
In Table 4.2. below, we evaluate social cohesion from the perspective of the three foundational requirements for social cohesion as identified by the Institute: demographic integration, a sense of connectedness to the country, and a sense of community. The basis for the interpretation is the findings from the aforementioned GovDem Poll. Once again, where the results of the survey, as it relates to demographic integration and sense of community, where the majority sentiment was positive, it was recorded as a positive (+). And where the majority sentiment was negative, it was recorded as a negative (-). In terms of a sense of connectedness, the only test was that of emigration. In this regard any loss of skills and capital should be avoided. Whilst single digit percentages may be argued one way or the other, double-digit percentages in an environment lacking skills and capital, will certainly be an indication of a problem.
In terms of demographic integration, two of the four criteria tested were recorded as positive. In terms of a sense of connectedness to the country, 11 percent of skilled and high-income workers indicated that they were considering emigrating, thereby attracting a negative score. And in terms of a sense of community, two out of the six trust tests secured a positive finding, one was borderline and three were negative.

Table 4.2.: Evaluating social cohesion in terms of demographic integration, connectedness and community
The empirical evidence provided through the GovDem survey, in particular, should provide little comfort to those tasked with promoting reconciliation and nation building in South Africa, be they public policymakers or civil society. The bedrock on which to grow a successful economy, and to build a just and secure society, is social cohesion. In many respects, this is, in large measure, lacking within South African society.
It is hoped that this report will motivate the country’s policymakers to prioritise programmes aimed at improving social cohesion in South Africa. It requires a concerted, ongoing, focussed and sustainable effort, equal to those efforts deployed, for example, to grow the economy or to improve the country’s safety and security, all of which will come to nought in the absence of social cohesion.
In an effort to focus heightened attention and energy on the nation’s quest to overcome its deeply divided past, it will be important for the authorities to continuously evaluate the state of play. To this end they will need a reliable measuring instrument. After all, the economy, social services, and most other deliverables, are measured and dissected on an ongoing basis. And so too should the foundation on which it is all built – social cohesion.
The Inclusive Society Institute is committed to develop such a Social Cohesion Index, or Radar, which will assist public policymakers in their task to assess, monitor, and progress social cohesion more effectively. In tracking such cohesion, they would gain the capacity to, on an annual basis, determine the level to which social cohesion has either progressed or regressed; and to establish the degree to which the elements and determinants needed to underpin such cohesion, require attention.
References
Allie, M. 2021. Race in South Africa: 'We haven't learnt we are human beings first'.
[Online] Available at: https://www.bbc.com/news/world-africa-55333625 [accessed: 5 January 2022].
Andrews, R. 2011. Religious Communities, Immigration and Social Cohesion in Rural Areas: Evidence from England. Rural Sociology, 76(4): 535-561.
Australian Human Rights Commission. 2015. Building Social Cohesion in our Communities. [Online] Available at: https://humanrights.gov.au/our-work/race-discrimination/publications/building-social-cohesion-our-communities [accessed: 4 January 2022].
Bertotti, M., Adams-Eaton, F., Sheridan, K. & Renton, A. 2016. Understanding and fostering social cohesion. [Online] Available at: https://www.ncbi.nlm.nih.gov/labs/pmc/articles/PMC5066839/ [accessed: 5 January 2022].
Bosch, A. 2021. Gender inequality at work. [Online] Available at: https://www.usb.ac.za/usb_insights/gender-inequality-at-work/?gclid=Cj0KCQiAoNWOBhCwARIsAAiHnEgepkV1n2sIRkqe-unDKlapNCpeTtEOpLVax14dfVy-m5mI_g_Pt_waAnLiEALw_wcB [accessed: 5 January 2022].
Bris, A. 2014. Social Cohesion – Why it matters. [Online] Available at: https://www.imd.org/research-knowledge/articles/com-april-2014/ [accessed: 4 January 2022].
BusinessTech. 2021. This is the school drop out rate in South Africa. [Online] Available at: https://businesstech.co.za/news/government/438509/this-is-the-school-drop-out-rate-in-south-africa/ [accessed: 5 January 2022].
Cilliers, J. 2021. Rainbow Nation. Changing the Conversion. [Online] Available at: https://www.dandc.eu/en/article/racial-tensions-haunt-south-africa-impeding-countrys-progress [accessed: 5 January 2022].
Development Bank of Southern Africa (DBSA). 2022. Challenges that hinder youth empowerment and how to overcome them. [Online] Available at: https://www.dbsa.org/article/challenges-hinder-youth-empowerment-and-how-overcome-them [accessed: 6 January 2022].
Friedman, C. 2019. Language Barrier Challenge in South African Schools. [Online] Available at: file:///C:/Users/dswan/Downloads/Language_Barrier_Challenge_in_South_Afri.pdf [accessed: 6 January 2022].
German Development Institute (DIE). 2019. Social cohesion and economic development: Unpacking the relationship. [Online] Available at: https://www.die-gdi.de/en/briefing-paper/article/social-cohesion-and-economic-development-unpacking-the-relationship/ [accessed 3 January 2022].
Gifford, G. 2021. New crime stats show SA remains ‘a very violent country’. [Online] Available at: https://www.timeslive.co.za/news/south-africa/2021-11-19-new-crime-stats-show-sa-remains-a-very-violent-country/ [accessed: 5 January 2022].
History. N.d. Apartheid. [Online] Available at: https://www.history.com/topics/africa/apartheid [accessed: 4 January 2022].
Jensen, J. 2002. Making connections: Culture and Social cohesion in the new millennium. Canadian Journal of Communication, 27(2).
Langer, A., Stewart, F., Smedts, K. & Demarest, L. 2017. Social Cohesion Index. [Online] Available at: https://www.socialcohesion.info/concepts/concept/arnim-langer-/-frances-stewart-/-kristien-smedts-/-leila-demarest [accessed: 4 January 2022].
Manaliyo, J.C. 2016. Barriers to community participation in crime prevention in low income communities in Cape Town. [Online] Available at: https://www.researchgate.net/publication/349063604_BARRIERS_TO_COMMUNITY_PARTICIPATION_IN_CRIME_PREVENTION_IN_LOW_INCOME_COMMUNITIES_IN_CAPE_TOWN [accessed: 5 January 2022].
Matema, T. 2021. If we want to fight xenophobia, we need to change the narrative about migrants in South Africa. [Online] Available at: https://www.dailymaverick.co.za/article/2021-04-07-if-we-want-to-fight-xenophobia-we-need-to-change-the-narrative-about-migrants-in-south-africa/ [accessed: 4 January 2022].
Mbanga, S. 2020. Policy exists, but shacklands spring up. [Online] Available at: https://mg.co.za/analysis/2020-06-25-policy-exists-but-shacklands-spring-up/ [accessed: 5 January 2022).
Moosa, M. N.d. South Africa’s trust deficit and COVID-19. [Online] Available at: https://www.ijr.org.za/2020/06/30/south-africas-trust-deficit-and-covid-19/ [accessed: 5 January 2022].
Naidoo, M. & Nkosi, N. 2021. Phoenix racial tension doused for now. [Online] Available at: https://www.iol.co.za/sunday-tribune/news/phoenix-racial-tension-doused-for-now-f97559ba-3948-4470-abe9-59b5994bcf44 [accessed: 5 January 2022].
Neff, D. 2021. Subjective well-being, poverty and ethnicity in South Africa: Insights from an exploratory analysis. [Online] Available at: https://www.ophi.org.uk/wp-content/uploads/Neff.pdf [accessed: 5 January 2022].
Phendu, S. 2019. Assessing the state of public participation in the Western Cape: the case of Beaufort West municipality (2016 – 2019). [Online] Available at: http://etd.uwc.ac.za/xmlui/bitstream/handle/11394/7807/Phendu_MA_2019.pdf?sequence=1&isAllowed=y http://etd.uwc.ac.za/xmlui/bitstream/handle/11394/7807/Phendu_MA_2019.pdf?sequence=1&isAllowed=y [accessed: 6 January 2022].
Pikoli, Z. 2021. Inequality is fuelling racism in South Africa, says Human Rights Commission. [Online] Available at: https://www.dailymaverick.co.za/article/2021-06-22-inequality-is-fuelling-racism-in-south-africa-says-human-rights-commission/ [accessed: 4 January 2022].
Ramaphosa, C. 2021. From the desk of the president. [Online] Available at: https://www.gov.za/blog/desk-president-85 [accessed: 6 January 2022].
Republic of South Africa (RSA). N.d. South African Reconstruction and Recovery Plan. [Online] Available at: https://www.gov.za/sites/default/files/gcis_document/202010/south-african-economic-reconstruction-and-recovery-plan.pdf [accessed: 5 January 2022].
Ryan, C. 2021. Foreign truck drivers attacked under cover of looting, demand compensation from SA. [Online] Available at: https://www.moneyweb.co.za/news/south-africa/foreign-truck-drivers-attacked-under-cover-of-looting-demand-compensation-from-sa/ [accessed; 5 January 2022].
Scanlon Foundation Research Institute (SFRI). N.d. What is social cohesion? [Online] Available at: https://scanloninstitute.org.au/what-social-cohesion [5 January 2022).
Shackleton, C.M. & Gwedla, N. 2021. The Legacy Effects of Colonial and Apartheid Imprints on Urban Greening in South Africa: Spaces, Species, and Suitability. [Online] Available at: https://www.frontiersin.org/articles/10.3389/fevo.2020.579813/full [accessed: 6 January 2022].
South African Human Rights Council (SAHRC). 2021. Inequality is fuelling racism in South Africa, says Human Rights Commission [Online] Available at: https://www.sahrc.org.za/index.php/sahrc-media/news/item/2724-inequality-is-fuelling-racism-in-south-africa-says-human-rights-commission [accessed: 28 March 2022].
Statistics South Africa (Stats SA). 2021. Erroneous reporting of undocumented migrants in SA. [Online] Available at: http://www.statssa.gov.za/?p=14569 [accessed: 5 January 2022].
Tau, R. 2021. The only way to stop this spiral of violence and racism is to act decisively on poverty. [Online] Available at: https://www.dailymaverick.co.za/opinionista/2021-07-19-the-only-way-to-stop-this-spiral-of-violence-and-racism-is-to-act-decisively-on-poverty/ [accessed: 4 January 2022].
Tänzler, N. & Grimalsa, G. 2018. Understanding and fostering social cohesion. [Online] Available at: https://www.g20-insights.org/policy_briefs/understanding-and-fostering-social-cohesion/ [accessed: 5 January 2022].
The Presidency. N.d. History and Political Context. [Online] Available at: https://www.thepresidency.gov.za/content/historical-and-political-context [accessed: 4 January 2022].
Trading Economics. N.d. South Africa youth unemployment rate. [Online] Available at: https://tradingeconomics.com/south-africa/youth-unemployment-rate#:~:text=Youth%20Unemployment%20Rate%20in%20South%20Africa%20averaged%2054.21%20percent%20from,the%20fourth%20quarter%20of%202014 [accessed: 5 January 2022].
Warah, R. 2021. COVID-19 has exposed South Africa’s glaring and enduring inequalities. [Online] Available at: https://www.one.org/africa/blog/covid19-exposed-south-africa-inequalities/ [accessed 5 January 2022].
- - - - - - - - - - - - - - - - - - - - - - - - - - - - - - - - -
This report has been published by the Inclusive Society Institute
The Inclusive Society Institute (ISI) is an autonomous and independent institution that functions independently from any other entity. It is founded for the purpose of supporting and further deepening multi-party democracy. The ISI’s work is motivated by its desire to achieve non-racialism, non-sexism, social justice and cohesion, economic development and equality in South Africa, through a value system that embodies the social and national democratic principles associated with a developmental state. It recognises that a well-functioning democracy requires well-functioning political formations that are suitably equipped and capacitated. It further acknowledges that South Africa is inextricably linked to the ever transforming and interdependent global world, which necessitates international and multilateral cooperation. As such, the ISI also seeks to achieve its ideals at a global level through cooperation with like-minded parties and organs of civil society who share its basic values. In South Africa, ISI’s ideological positioning is aligned with that of the current ruling party and others in broader society with similar ideals.
Email: info@inclusivesociety.org.za
Phone: +27 (0) 21 201 1589
Web: www.inclusivesociety.org.za


Comments